

94%
of battery-grade graphite was made in China in 2025.
Source: IEA, Global Critical Minerals Outlook 2026
Cookies on this site
This site sets no cookies and uses no analytics. Your browser keeps the choice you make here.
Cookie settings
Choose what this site may keep in your browser. Necessary settings are always on.
Necessary
Keeps the choice you make here and, for this visit only, a page transition setting and whether the intro has played.
Preferences
Not in use at the moment. Nothing is stored for it.

JournalPress
Figures, charts, data, pictures and papers from Europe’s Critical Materials Atlas, ready to use. Charts, data and texts are free under CC BY 4.0.
Press office
press@hercinia.eu
Hercinia is a Luxembourg company set up to acquire, finance and develop critical raw material deposits in Europe and the plants that process them.
Hercinia, Europe’s Critical Materials Atlas, CC BY 4.0
27 October 2026, with the news checked on 30 October 2026
Key figures
Copy a figure with its source and credit, or save it as a square card for social media.
94%
of battery-grade graphite was made in China in 2025.
Source: IEA, Global Critical Minerals Outlook 2026
18 of 35
materials: the EU imports 90% or more of its supply.
Source: European Commission, 2023 study (2016 to 2020)
22 of 35
materials: China holds the largest share of world mining or processing.
Source: USGS 2026; IEA 2026
24%
of EU consumption could be processed in the EU, against a 2030 benchmark of 40%.
Source: European Court of Auditors, Special report 04/2026, Critical raw materials for the energy transition (2016 to 2020)
12%
from EU recycling, against a 2030 benchmark of 25%.
Source: European Court of Auditors, Special report 04/2026, Critical raw materials for the energy transition (2016 to 2020)
€55.3bn
spent by the EU in 2025 on imports of critical raw materials and potash.
Source: Eurostat Comext; summed by Hercinia
€37.6bn
for batteries, solar modules and magnets in 2025, 91.7% of it from China.
Source: Eurostat Comext; summed by Hercinia
207 kg
of minerals in an electric car, against 34 kg in a conventional car.
Source: IEA (2021), CC BY 4.0
98%
of the rare earth magnets used in the EU come from China.
Source: JRC, 2023
99%
of EU borates came from Turkey.
Source: European Commission, 2023 study (2016 to 2020)
106
EU Strategic Projects selected since March 2025, with about €49.1bn of expected investment.
Source: European Commission, selections of March 2025, June 2025 and October 2026; summed by Hercinia
60 days
of use: Japan’s stock target for rare metals. Germany holds no state stockpile.
Source: JOGMEC; Bundestag printed paper 21/7684, 21 August 2026
Charts
Each chart saves as PNG for print and web, as SVG to restyle, with its data as CSV, or as embed code for your site. The files carry title, source and credit.
Processing
Processing is the tightest point
China’s share of world processing in 2025. Almost all heavy rare earth separation takes place in China.
Source: IEA (2026), Global Critical Minerals Outlook 2026, CC BY 4.0; USGS, Mineral Commodity Summaries 2026
Materials
How much the EU imports, and how concentrated supply is
Each dot is one material. Left to right: EU import reliance. Bottom to top: the largest share one country holds of world mining or processing.
Source: European Commission, Study on the critical raw materials for the EU (2023), averages 2016 to 2020; USGS, Mineral Commodity Summaries 2026; IEA (2026), Global Critical Minerals Outlook 2026, CC BY 4.0
Map
Where the largest share sits
Number of the 35 materials for which a country holds the largest share of world mining or processing.
Source: USGS, Mineral Commodity Summaries 2026; IEA (2026), Global Critical Minerals Outlook 2026, CC BY 4.0. Map: Natural Earth.
Single suppliers
Not only China
The largest single non-EU source of EU supply for each material, share of EU supply, 2016 to 2020.
Source: European Commission, Study on the critical raw materials for the EU (2023), averages 2016 to 2020
Materials
EU import reliance for 35 materials
Net imports as a share of EU consumption, 2016 to 2020. Labels give the country with the largest share of world mining or processing.
Source: European Commission, Study on the critical raw materials for the EU (2023), averages 2016 to 2020; USGS, Mineral Commodity Summaries 2026; IEA (2026), Global Critical Minerals Outlook 2026, CC BY 4.0
Products
An electric car holds six times the minerals of a conventional car
Kilograms per vehicle. Electric car with a 75 kWh NMC 622 battery: 207 kg; conventional car: 34 kg. Steel and aluminium not included.
Source: IEA (2021), Minerals used in electric cars compared to conventional cars, CC BY 4.0. This is a work derived by Hercinia from IEA material; it is not endorsed by the IEA.
What Europe spends
€37.6bn for three products, 91.7% of it from China
EU imports in 2025, €bn, by origin. Batteries already fitted in imported vehicles and devices are not counted.
Source: Eurostat Comext DS-045409, extra-EU imports 2025, summed by Hercinia. Eurostat is not responsible for this use of its data.
Industries
The industries that run on these materials
Jobs in the EU. ACEA and ASD use their own scope and are not comparable with Eurostat business statistics.
Source: Eurostat structural business statistics 2023; ACEA (automotive, direct and indirect); ASD (defence; civil aerospace is Hercinia’s estimate).
The 2030 gap
Europe is behind on all three capacity benchmarks
EU capacity as a share of EU consumption, averages 2016 to 2020, against the Critical Raw Materials Act benchmarks for 2030.
Source: European Court of Auditors, Special report 04/2026, Critical raw materials for the energy transition, capacity 2016 to 2020
Europe’s own supply
What Europe could supply itself by about 2040
Known European deposits plus recycling, as a share of EU demand. Hercinia’s assessment from the cited sources; resources are not reserves.
Source: SCRREEN factsheets and USGS 2026 (EU demand, known deposits); European Court of Auditors, Special report 04/2026, Figure 5 (EU capacity 2016 to 2020)
What Europe spends
The EU spent €55.3bn on critical raw material imports in 2025
Extra-EU imports by the EU-27 in raw and refined forms, €bn. Copper and aluminium make up 63.5%. The note gives China’s share of each bill.
Source: Eurostat Comext DS-045409, extra-EU imports 2025, summed by Hercinia. Eurostat is not responsible for this use of its data.
Public money
Public money for critical raw materials
€bn. The bars cover different instruments and periods: read each with its period and status, and do not add them up.
Source: Hercinia compilation from the European Commission, EIB, KfW, Euler Hermes (UFK), the French and Italian governments, CEZ, IFRI, US Department of Defense and JOGMEC; links in the data file. Converted at ECB reference rates of 27 October 2026.
Disruptions
Most cuts came in 2025 and 2026
Cuts in supply that reached European or allied industry, by year and cause. 2026 data to 27 October.
Source: Hercinia, Europe’s Critical Materials Atlas, disruption record, with the primary source for each event in the data file.
Export controls
China’s export controls on critical materials since 2023
Status as of 30 October 2026. No notice extending the October 2025 suspension has been published.
Source: MOFCOM and GACC announcements, including No. 70 of 2025 and No. 29 of 2026; USGS 2026; IEA 2026; CIRS; Fastmarkets.
Prices
How far prices rose after supply was cut
Multiple of the price before the cut. Log scale.
Source: IEA (2026), CC BY 4.0; Mining Reporters; Plansee; Tech Times (secondary source for yttrium).
Disruptions
When supply stopped, 2010 to 2026
Each cut in supply that reached European or allied industry. Newest at the top.
Source: Hercinia, Europe’s Critical Materials Atlas, disruption record; primary sources per event in the data file.
Stocks
Who holds stocks of critical raw materials
Japan and the United States hold stocks. In Europe, no stockpile is confirmed as running.
Source: JOGMEC; US Department of Defense; Al Jazeera (Project Vault); Australian Government; NATO, 7 July 2026; European Parliament; Bundestag printed paper 21/7684, 21 August 2026.
Coming up
Dates to watch
From 30 October 2026.
Source: Council of the EU; European Commission; MOFCOM; Edison; JRC RMIS; government notices as reported.
Defence
NATO’s 12 defence-critical raw materials
EU import reliance, average 2016 to 2020 (bars), and the country with the largest share of world mining or processing (note). Rare earths are shown as light and heavy.
Source: NATO, list of 12 defence-critical raw materials, 11 December 2024; European Commission, Study on the critical raw materials for the EU (2023), averages 2016 to 2020; USGS, Mineral Commodity Summaries 2026; IEA (2026), Global Critical Minerals Outlook 2026, CC BY 4.0
Defence
Rare earths in one defence platform
Kilograms of rare earth elements per unit. The F-35 contains more than 400 kg (900 lb).
Source: CSIS, The consequences of China’s new rare earths export restrictions, 14 April 2025
Recycling
From a used battery to new battery materials
Black mass is the powder left after spent cells are discharged, shredded and sieved. From 9 December 2026 it counts as hazardous waste in the EU.
Source: Commission Delegated Decision (EU) 2025/934, applies from 9 December 2026; Fraunhofer ISI (2025), Recycling capacities for lithium-ion batteries will exceed demand in Europe for the time being
Recycling
Europe has more shredding capacity than batteries to shred
Battery recycling in Europe, kt of batteries a year; figures for end 2026 and 2030 are forecasts. Plants run below capacity, and in mid-2025 Europe was a net exporter of black mass.
Source: Fraunhofer ISI (2025), Recycling capacities for lithium-ion batteries will exceed demand in Europe for the time being
Battery Regulation
What the EU asks of battery recycling
Left: targets for recovery of materials from waste batteries, by the end of 2027 and 2031. Right: minimum recycled content in new batteries, from August 2031 and 2036 (lead 85% in both).
Source: Regulation (EU) 2023/1542 on batteries, Article 8 and Annex XII
Infographics
For social media (4:5), for screens and slides (16:9), and as A3 posters for print.
Processing
China made 94% of the world’s battery-grade graphite in 2025.
Products
An electric car holds 207 kg of minerals. A conventional car holds 34 kg.
The 2030 gap
The EU could process about 24% of what it uses. The 2030 benchmark is 40%.
Disruptions
Thirteen cuts in supply reached European or allied industry in 2025 and 2026.
Defence
NATO lists 12 defence-critical materials. For 11 of them the EU imports 80% or more.
Recycling
Europe can shred far more batteries than it collects, and still exports black mass.
Calculator
Enter a fleet of electric cars, wind turbines, electrolysers or data centres and see the materials it needs, against what the EU uses in a year.
| Material | Needed | EU demand a year | Share of it |
|---|
Material cards
Pick a material and save its card: import reliance, the largest supplier, EU sources, what EU capacity could cover and the import bill.
Papers and articles
Pictures
Generated illustrations made for Hercinia. They show kinds of places and materials, not real sites, and none shows a Hercinia site. Free for editorial use with the credit “Picture: Hercinia”.
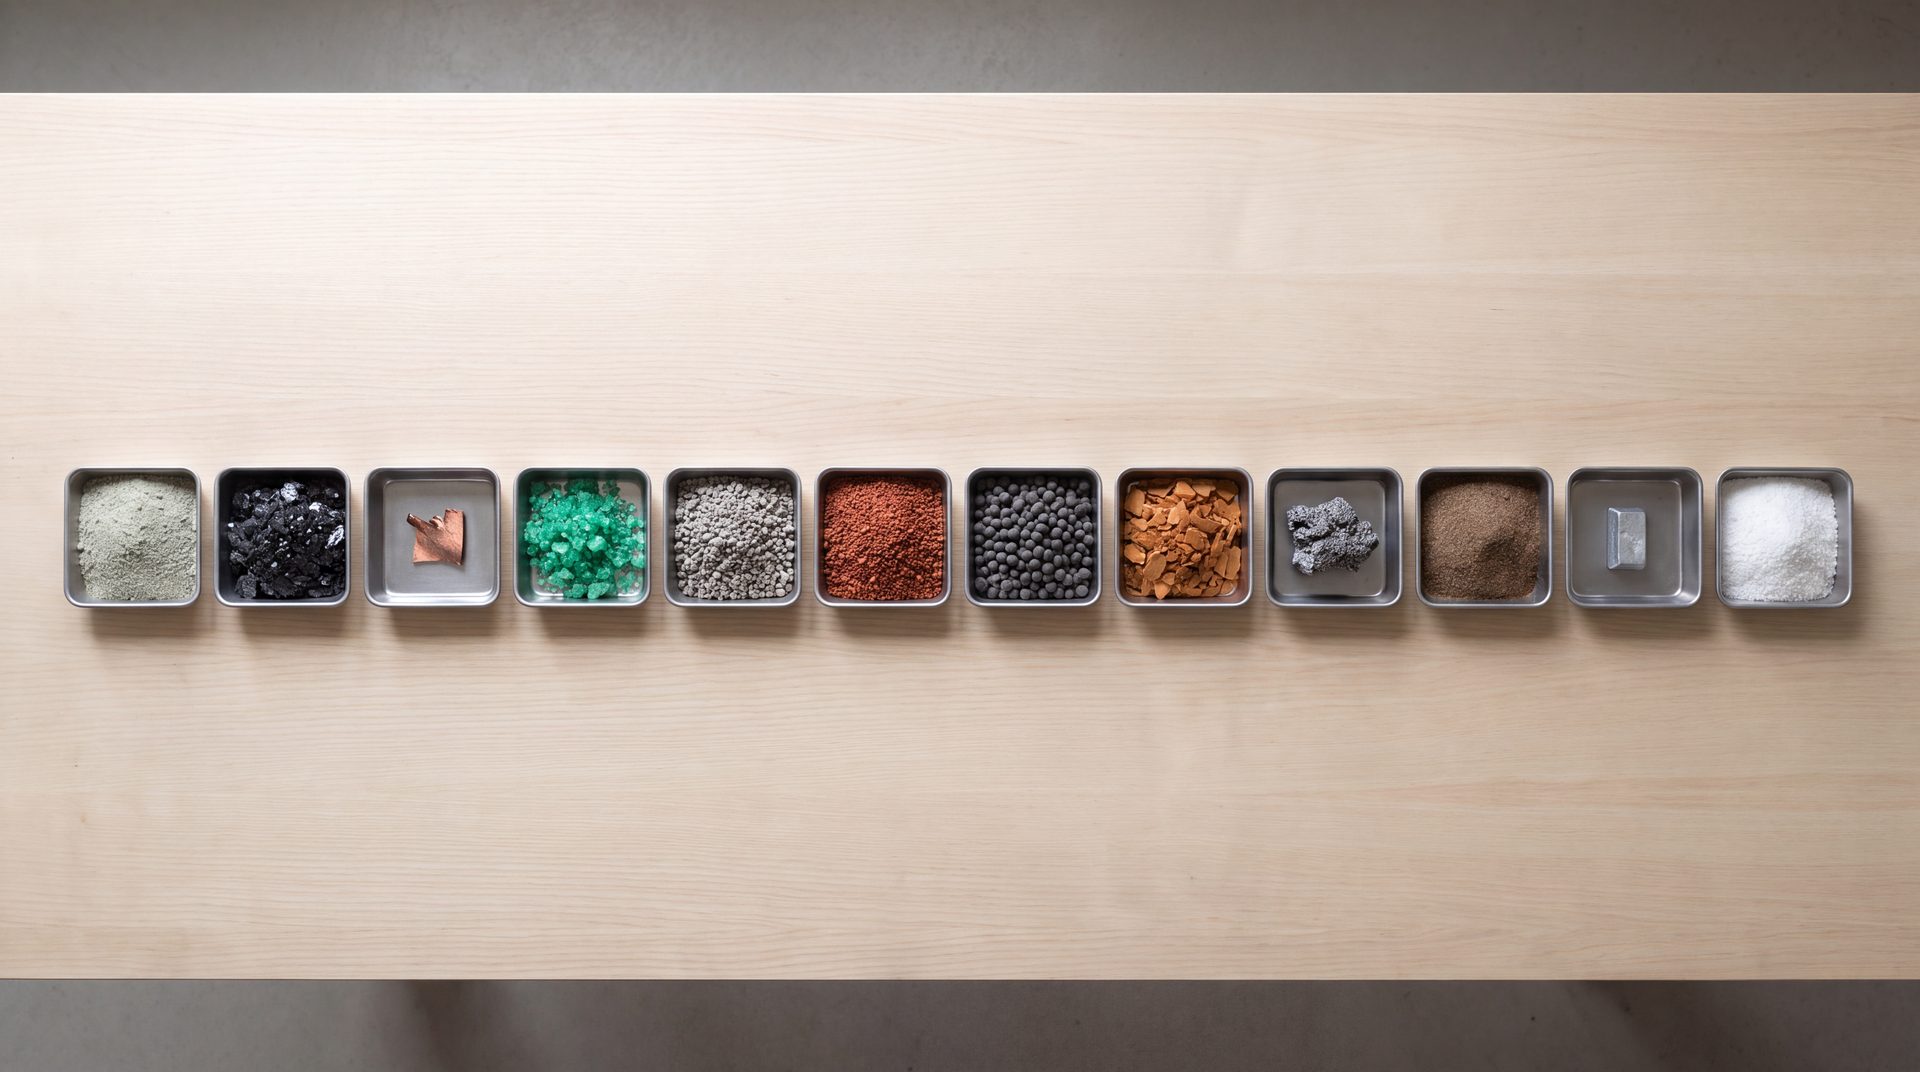
Twelve raw material samples in small steel trays on a pale wooden bench, from above.
Picture: Hercinia · 2880 px JPEG
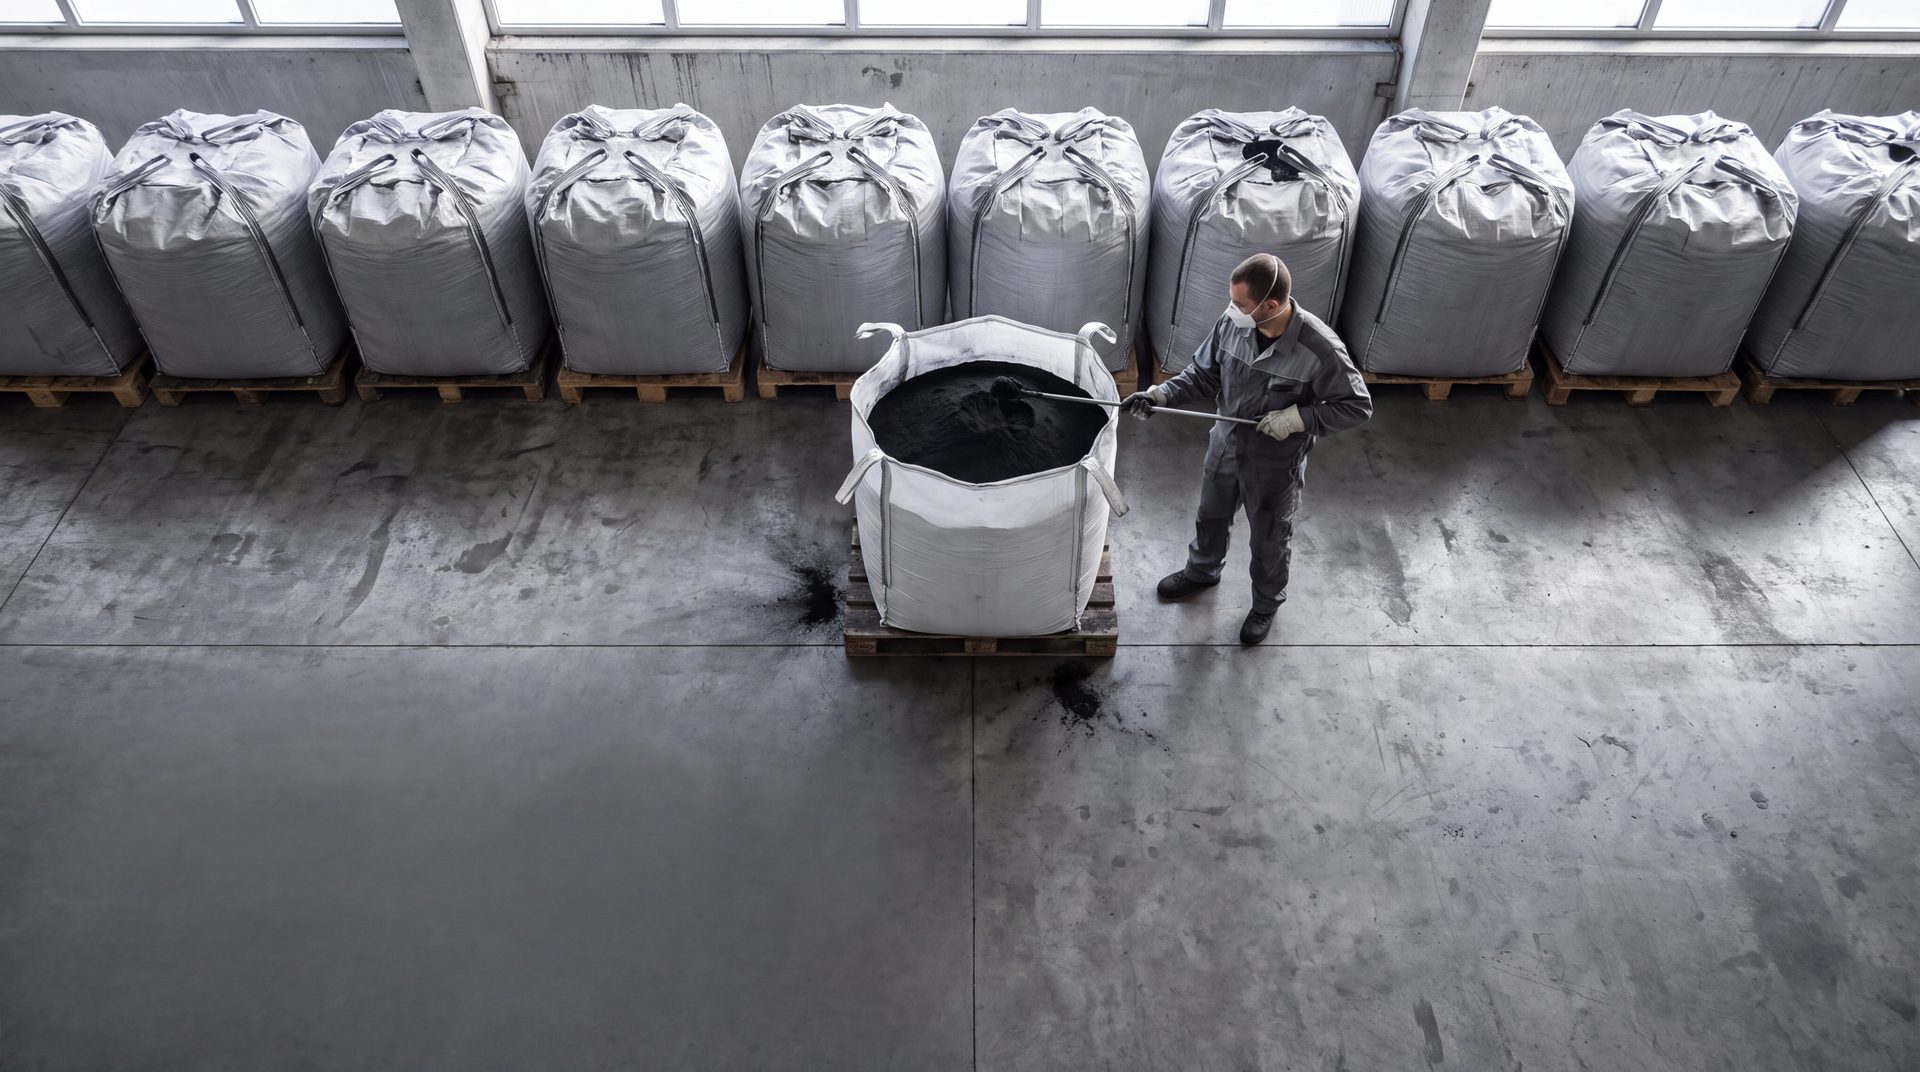
Bulk bags of black mass in a recycling hall; a worker samples an open bag, from above.
Picture: Hercinia · 2880 px JPEG
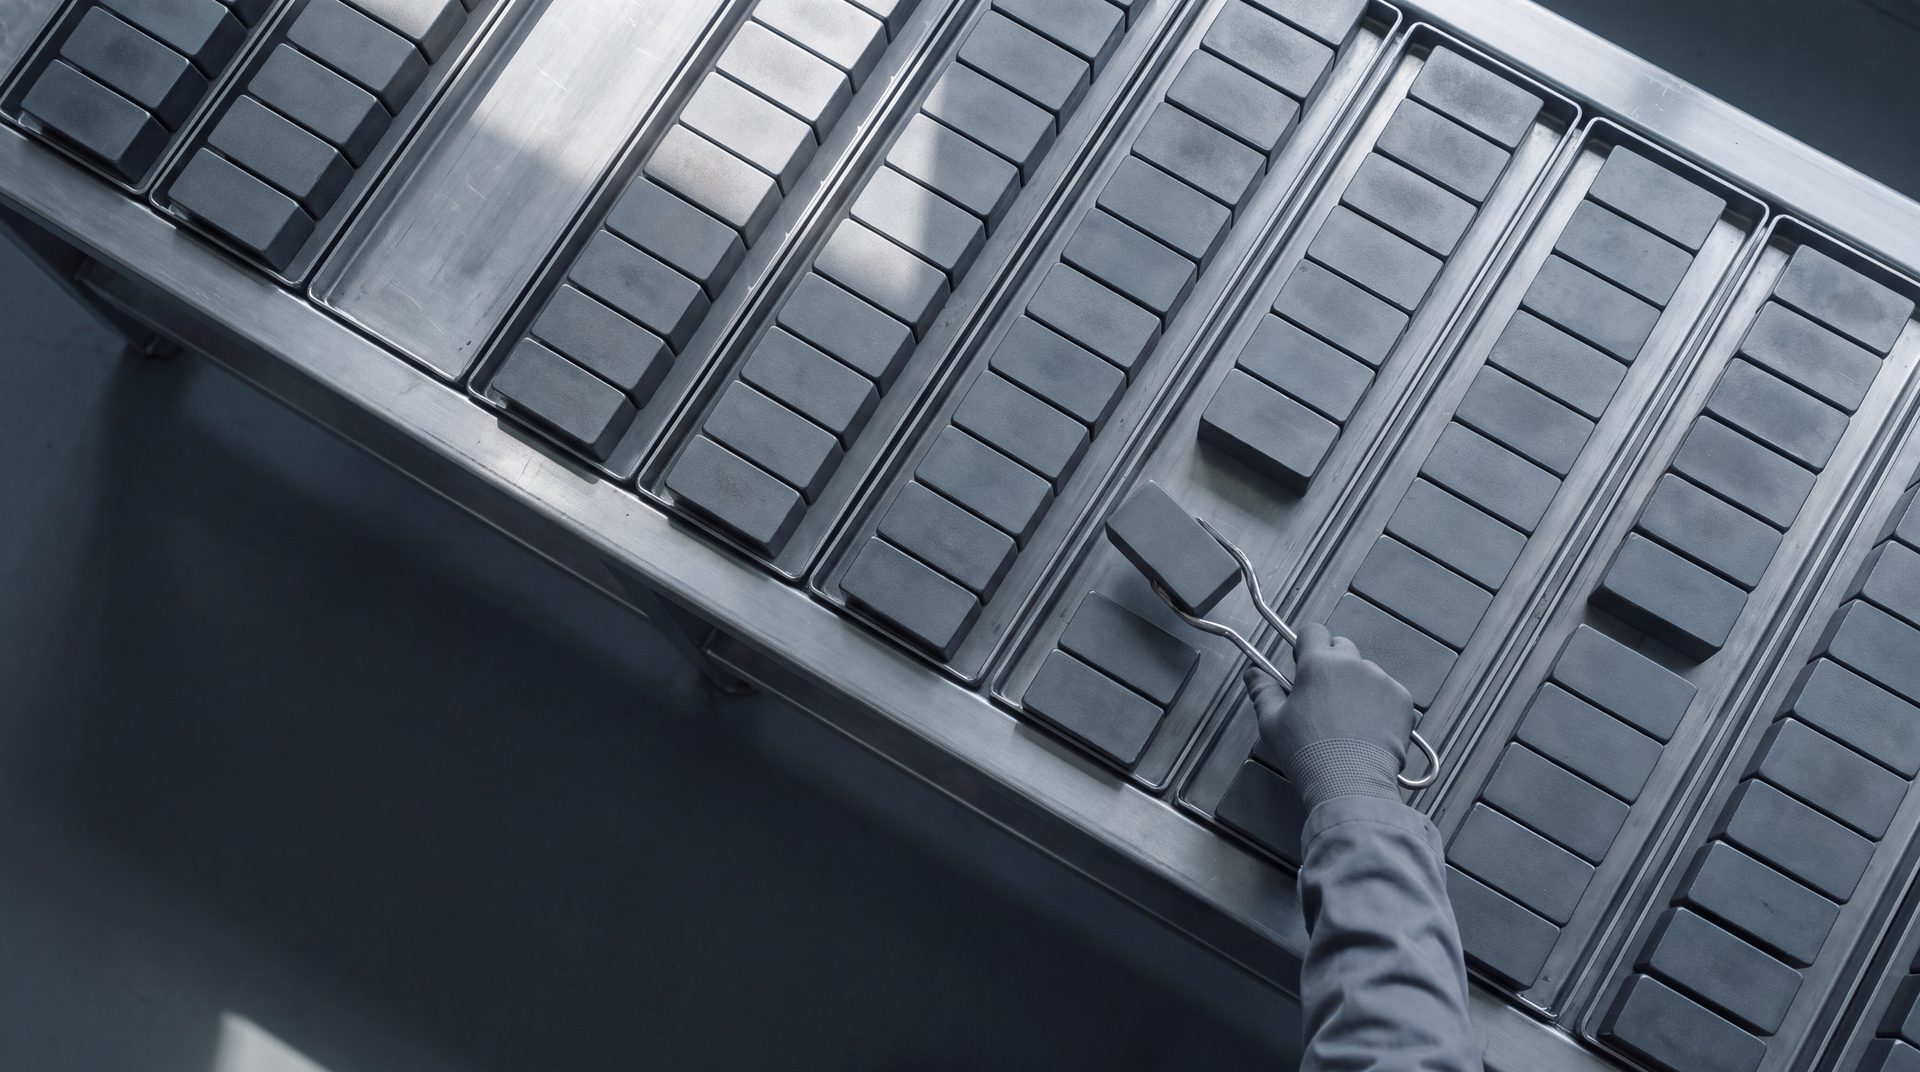
Sintered rare earth magnet blocks on steel trays; a gloved hand lifts one with tongs.
Picture: Hercinia · 2880 px JPEG
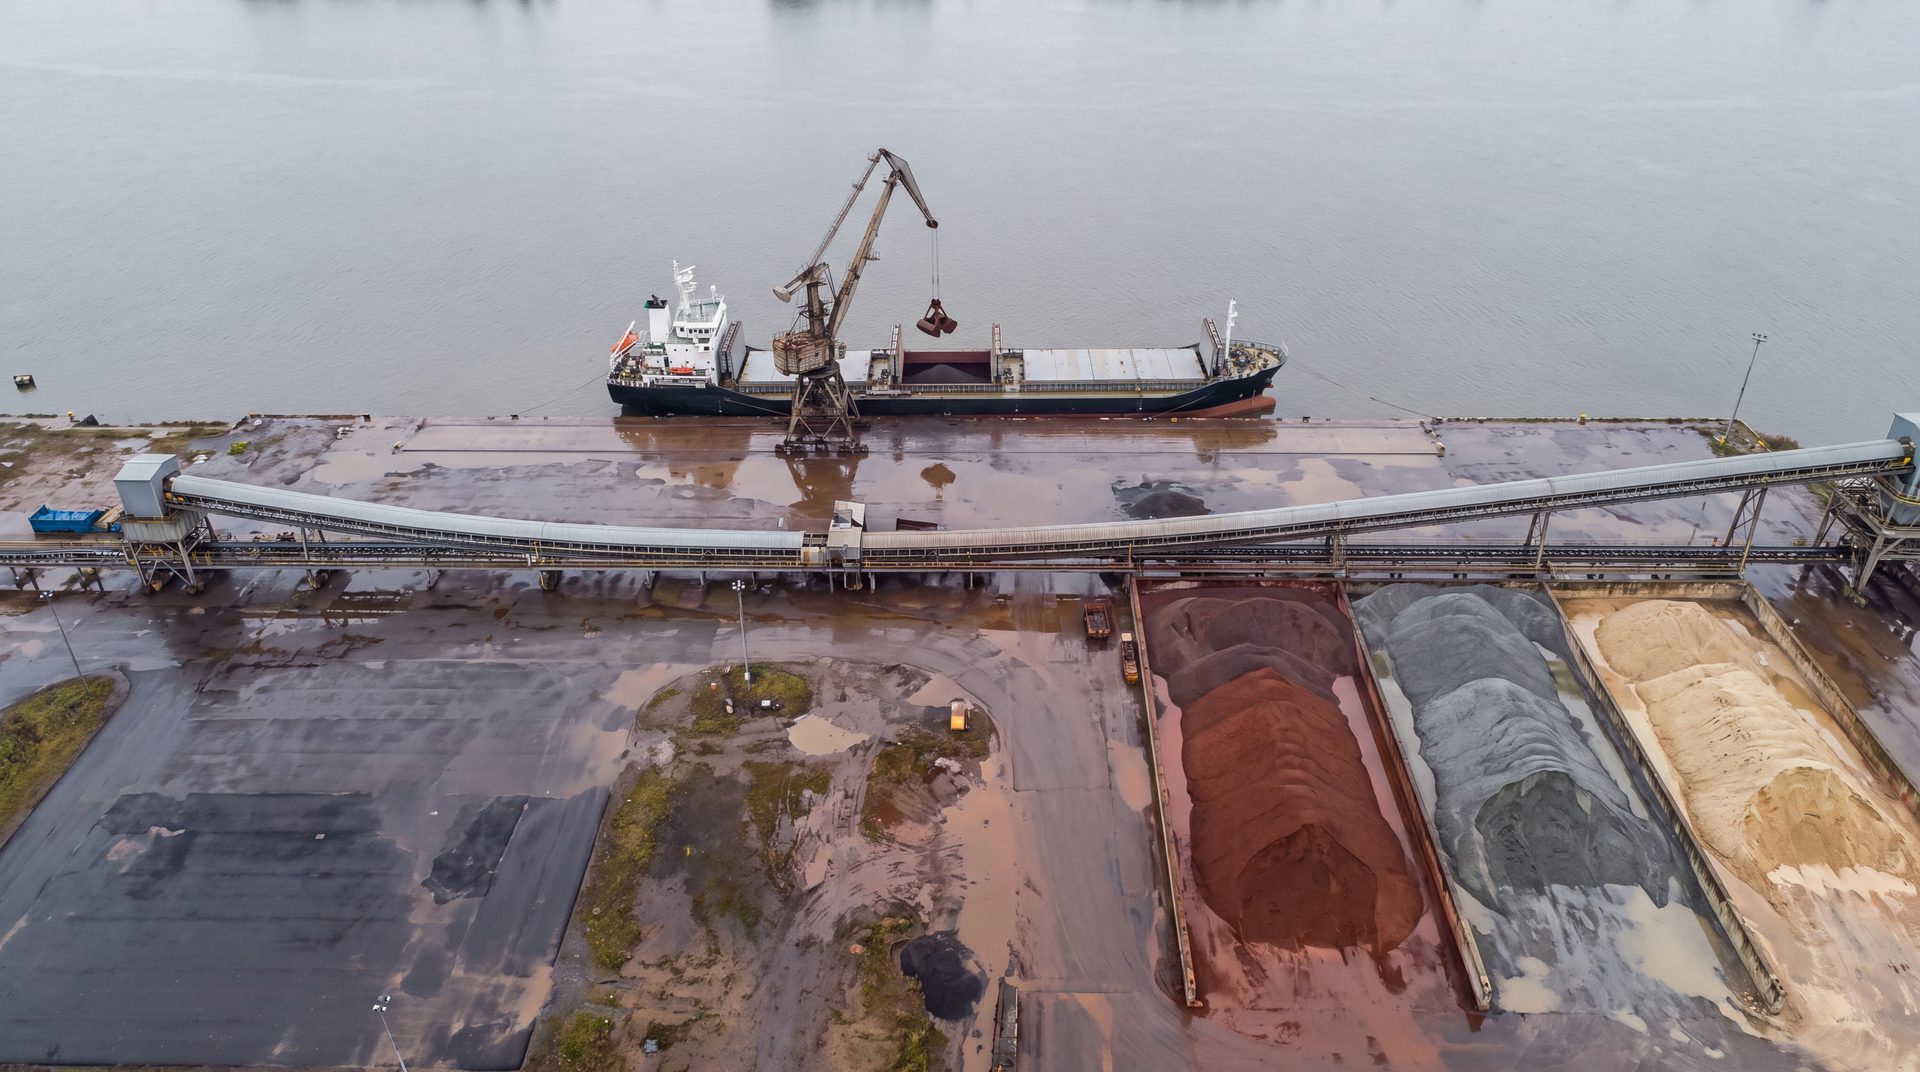
A bulk carrier unloading ore at a river port, ore stockpiles beside a conveyor, from above.
Picture: Hercinia · 2880 px JPEG
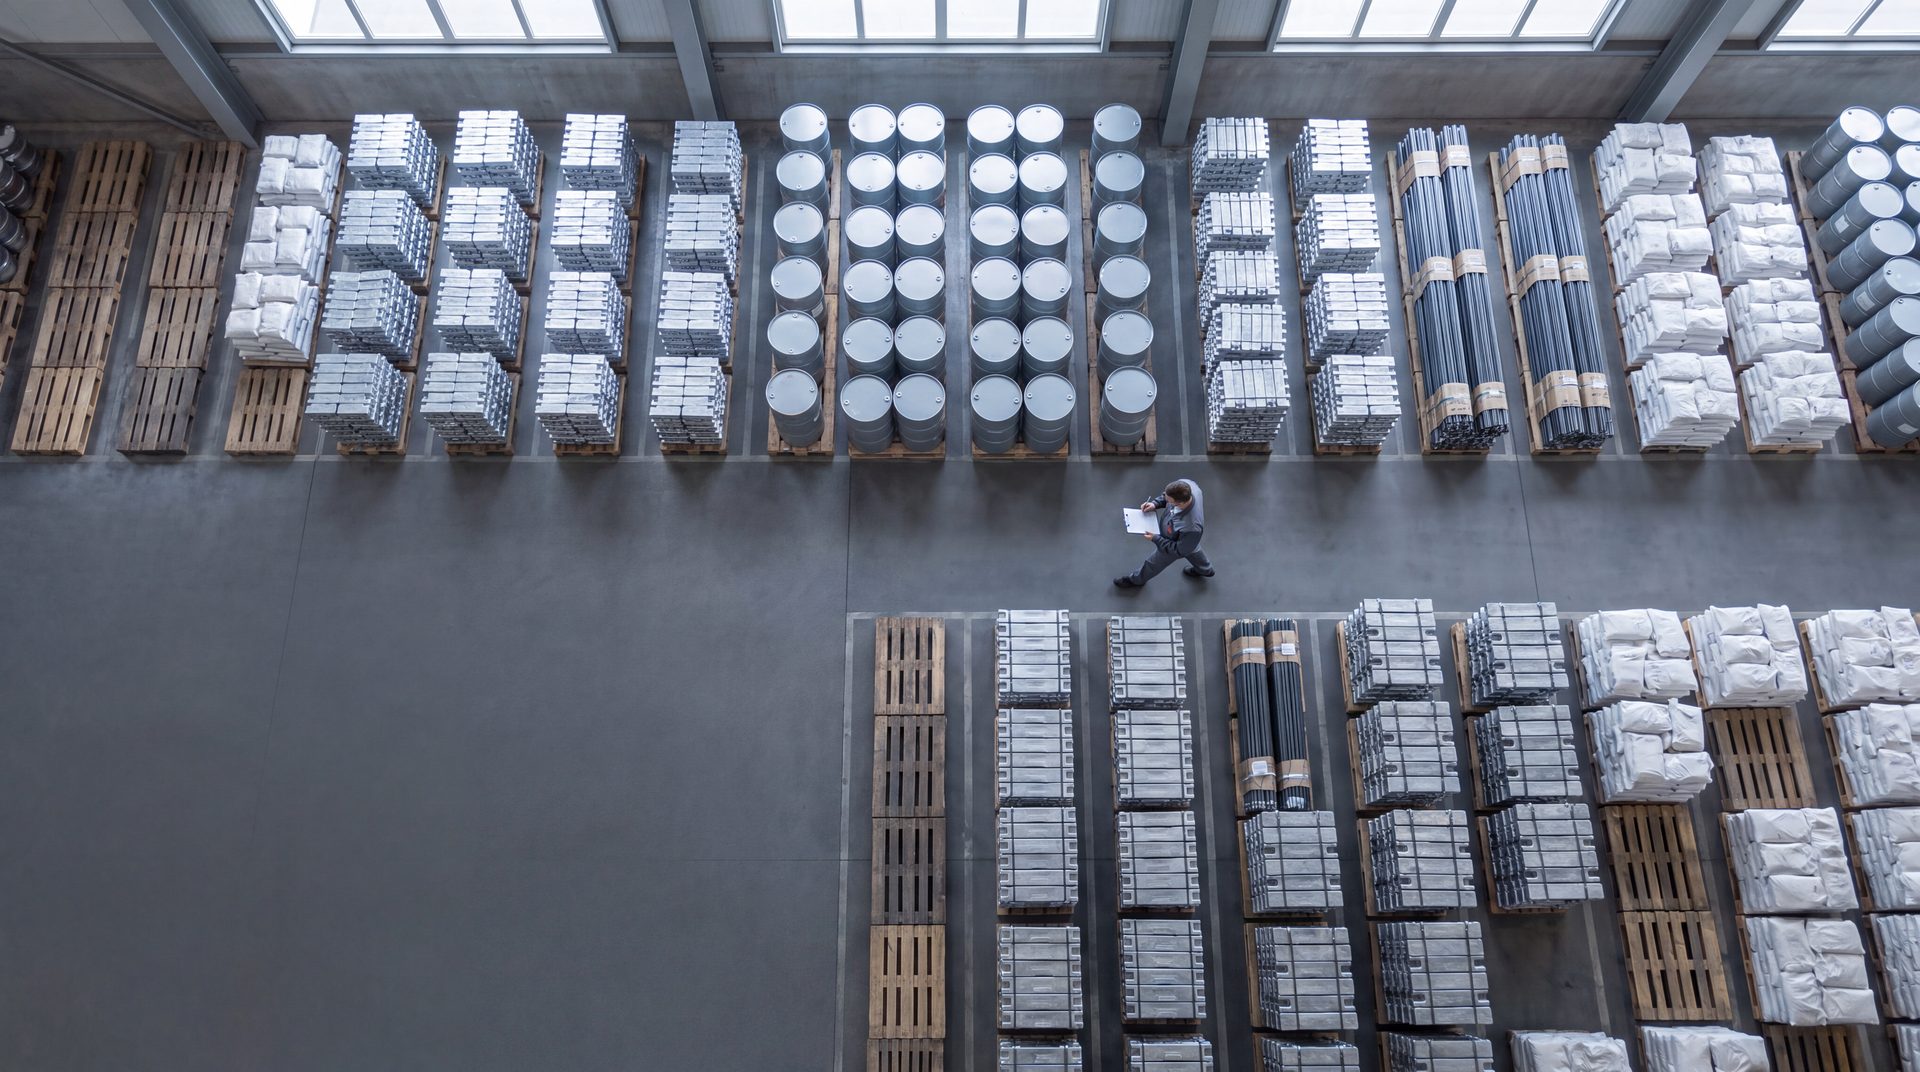
A materials store from above: drums, ingots and bundled rods on pallets, one person in the aisle.
Picture: Hercinia · 2880 px JPEG
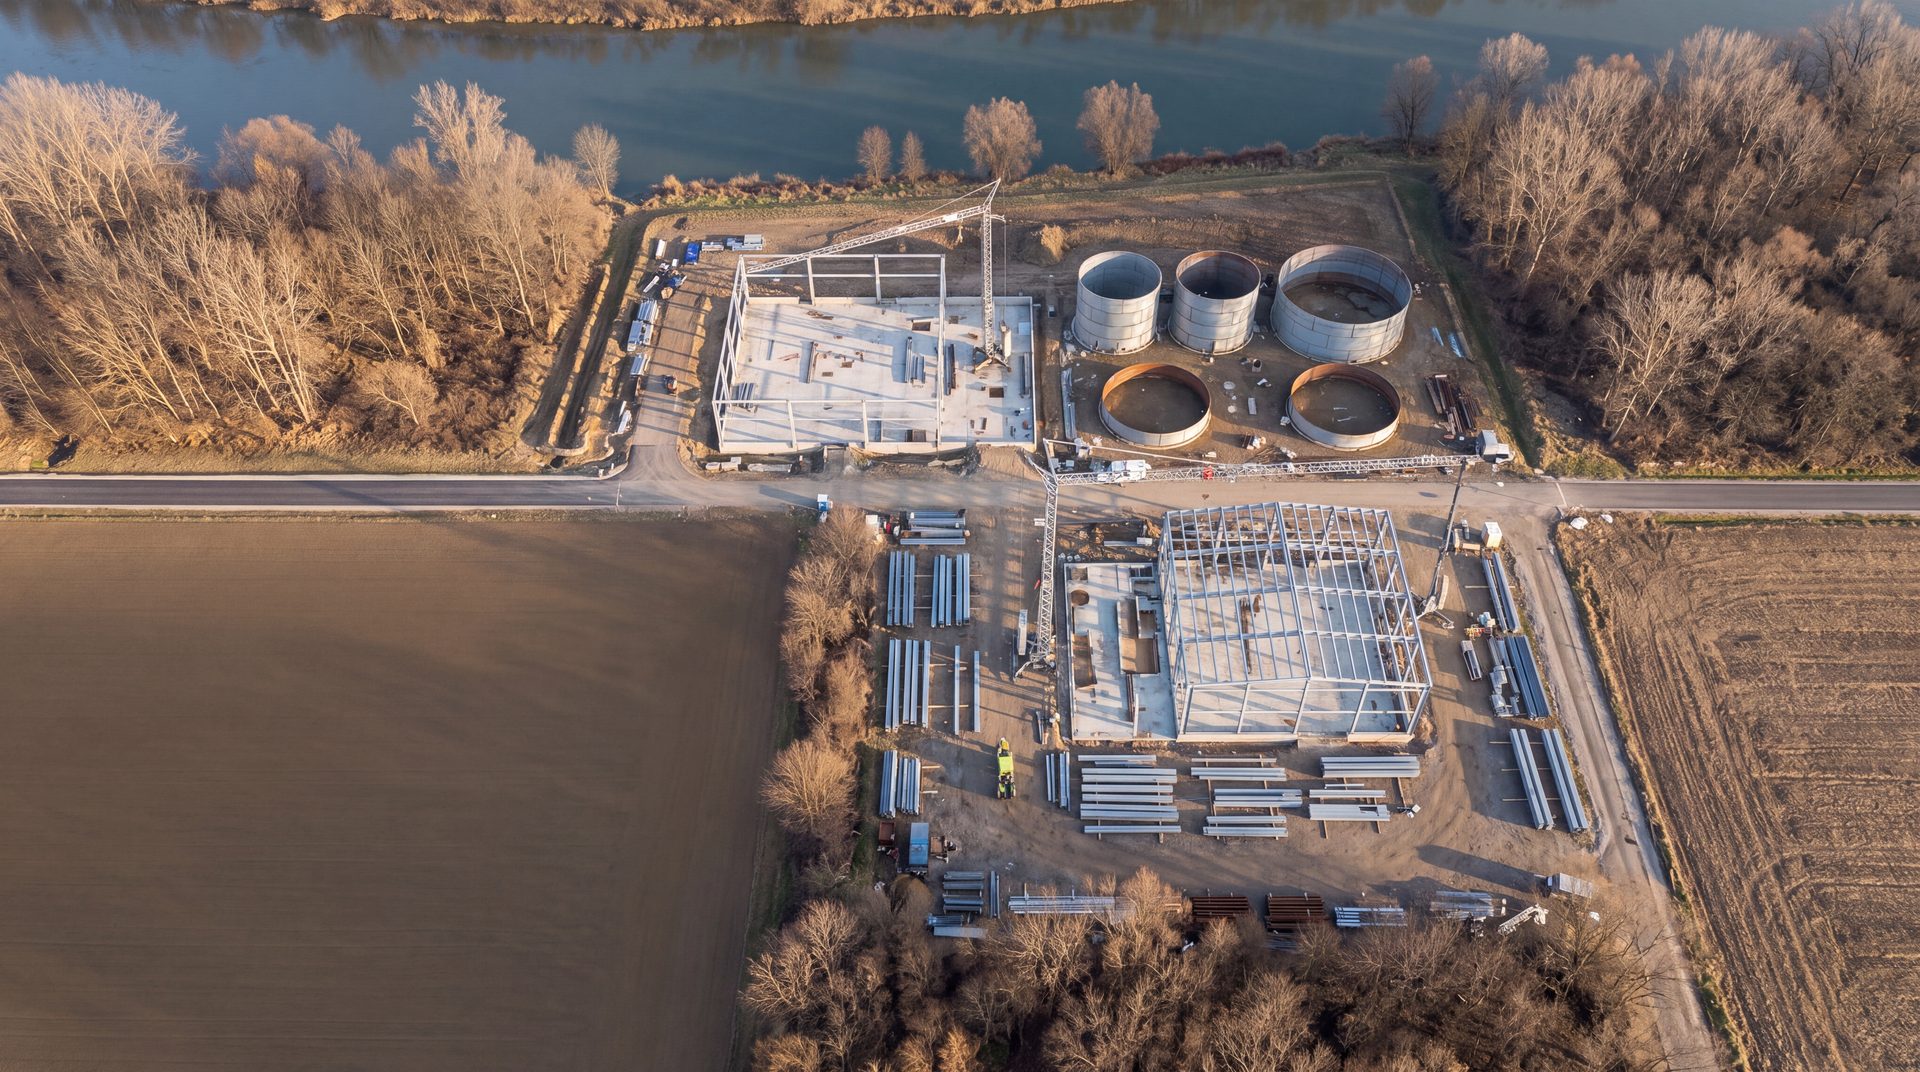
A processing plant under construction beside a river: frames, tanks and cranes, from above.
Picture: Hercinia · 2880 px JPEG
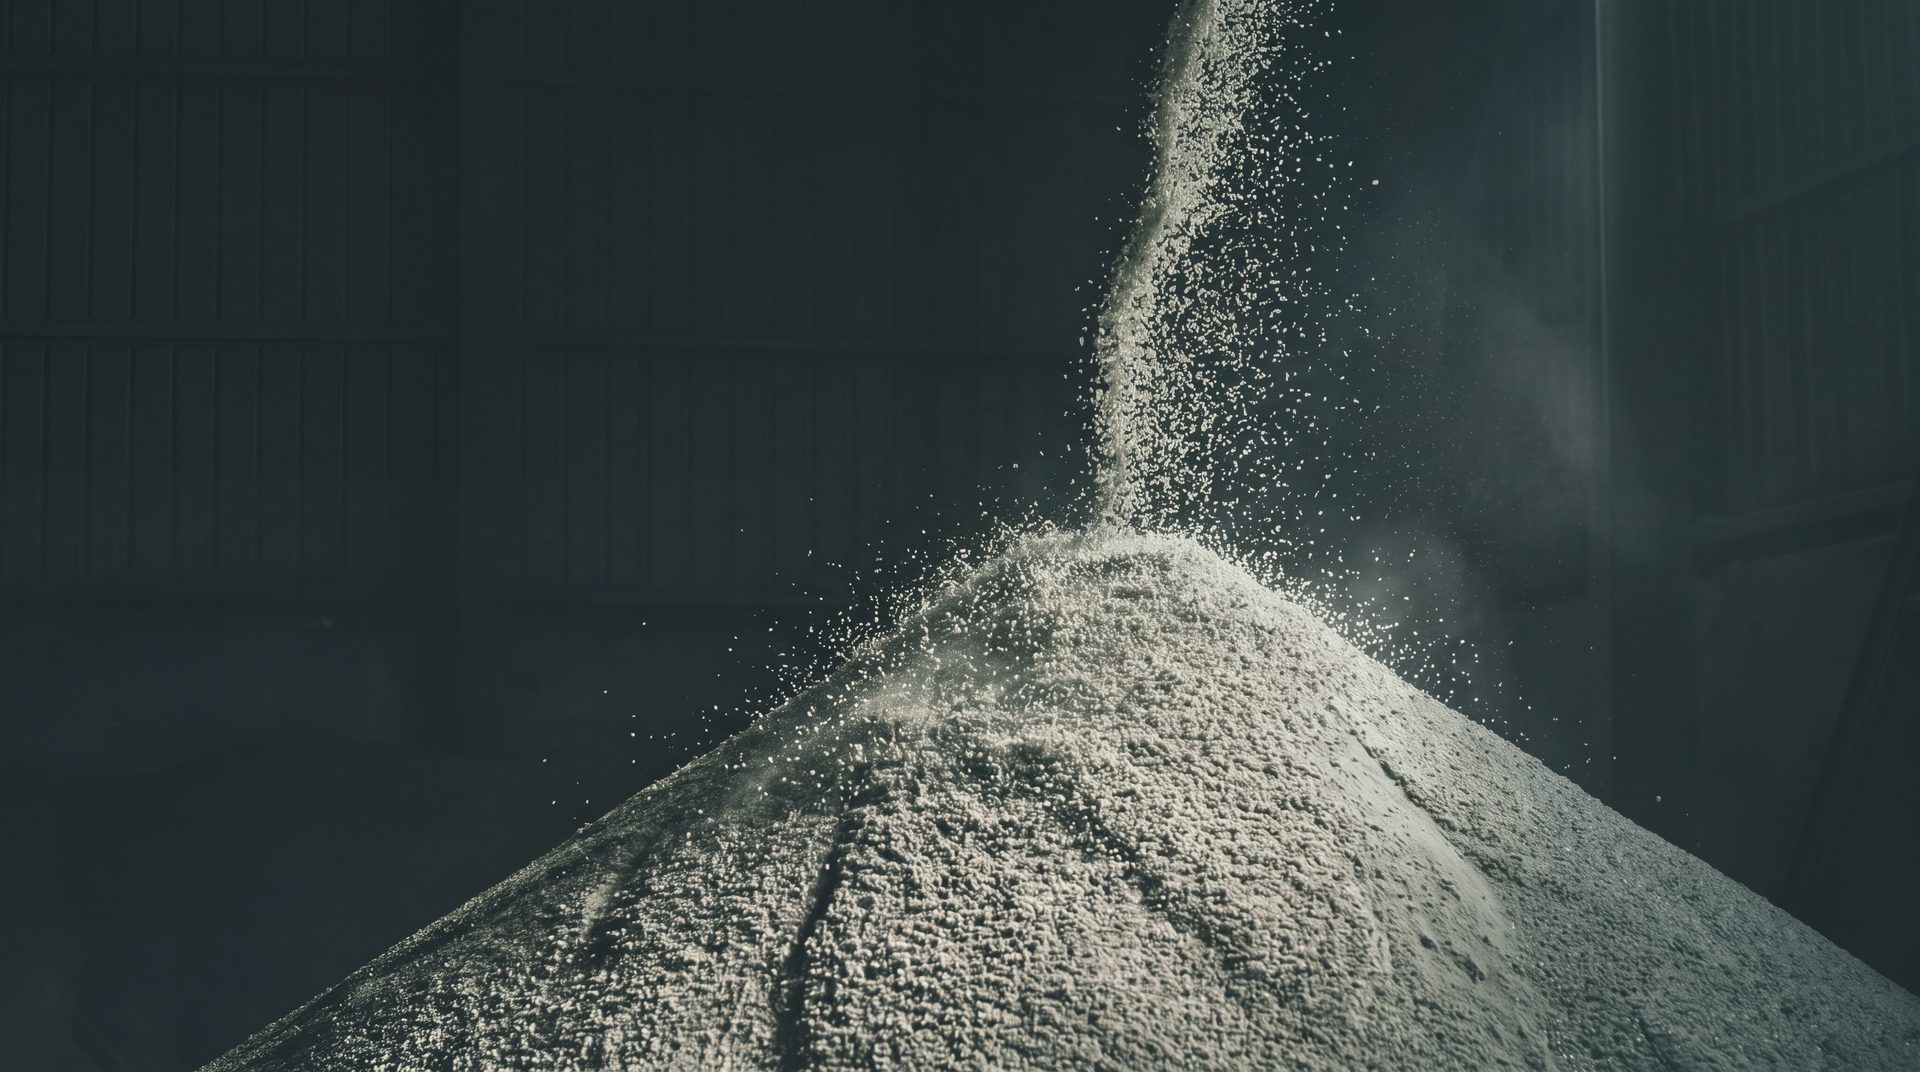
Spodumene concentrate falling onto a stockpile cone in a dark hall.
Picture: Hercinia · 2880 px JPEG
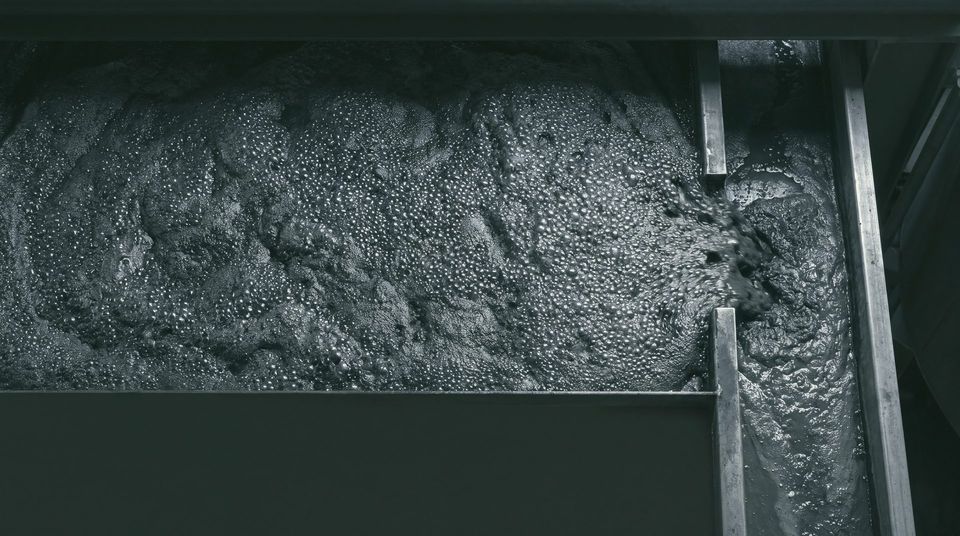
Dark froth of graphite flowing over the lip of a flotation cell, from above.
Picture: Hercinia · 2880 px JPEG
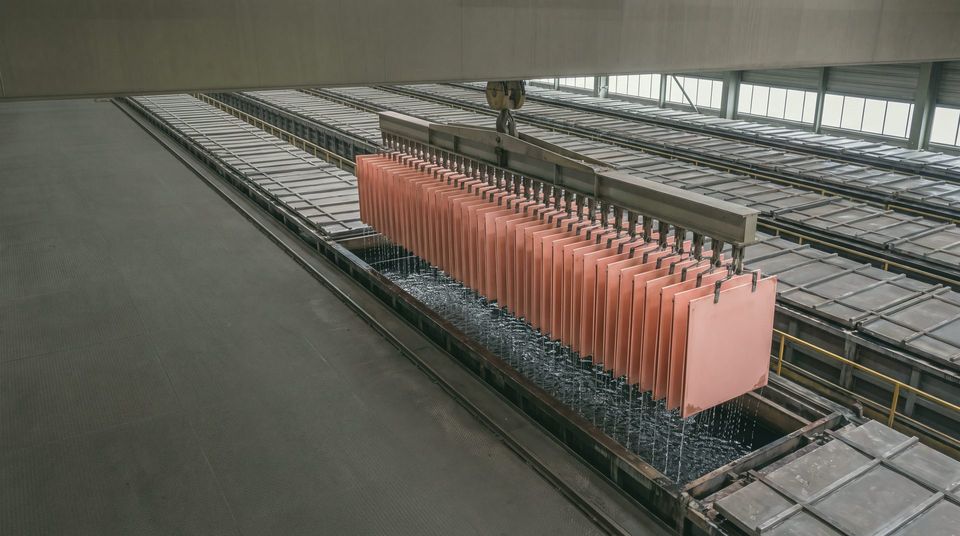
A crane lifts copper cathodes out of an electrolytic cell.
Picture: Hercinia · 2880 px JPEG
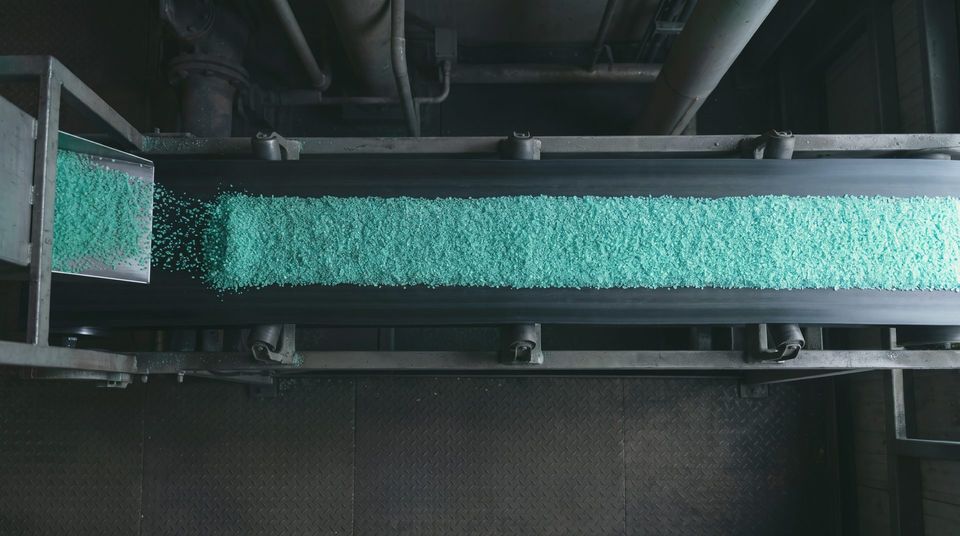
Green nickel sulphate crystals on a conveyor belt, from above.
Picture: Hercinia · 2880 px JPEG
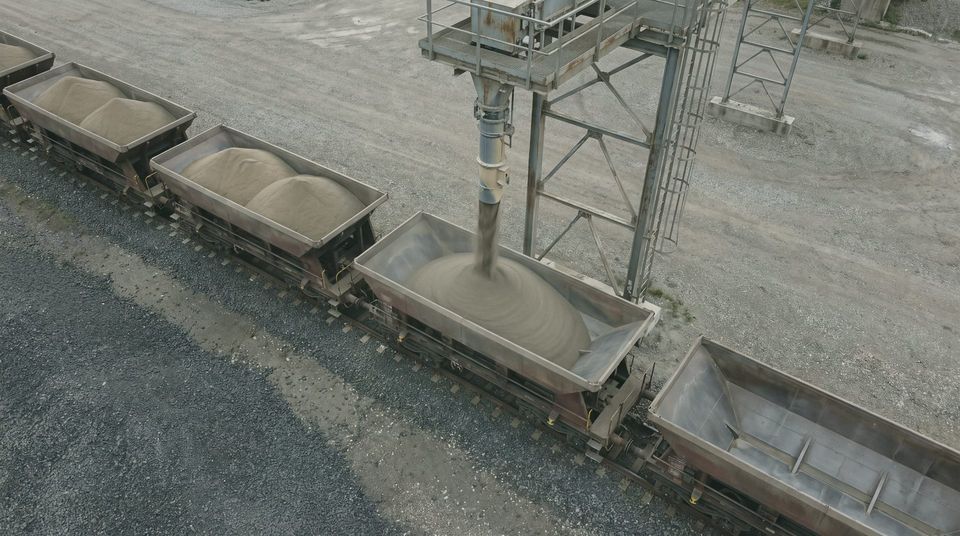
Phosphate rock concentrate loaded into rail wagons, from above.
Picture: Hercinia · 2880 px JPEG
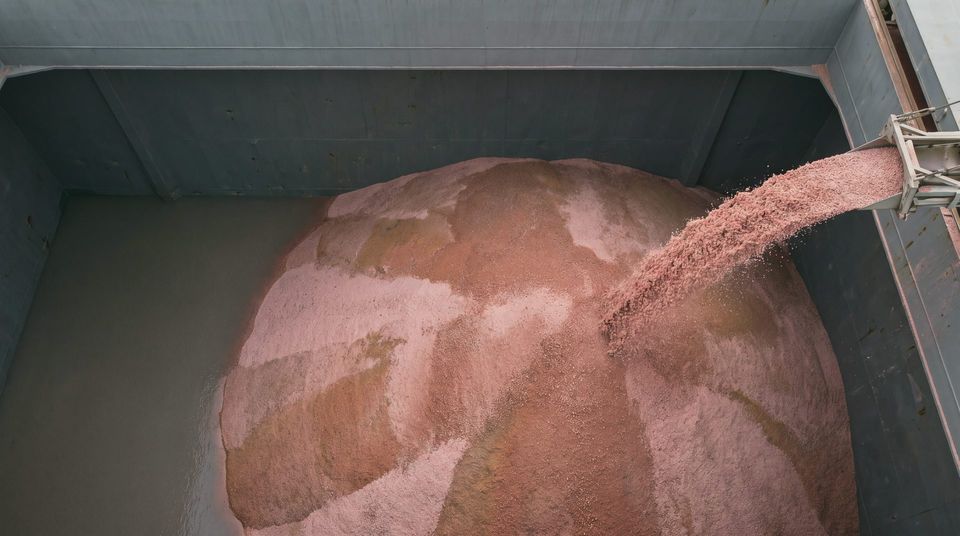
Pink potash granules loaded into the hold of a ship, from above.
Picture: Hercinia · 2880 px JPEG
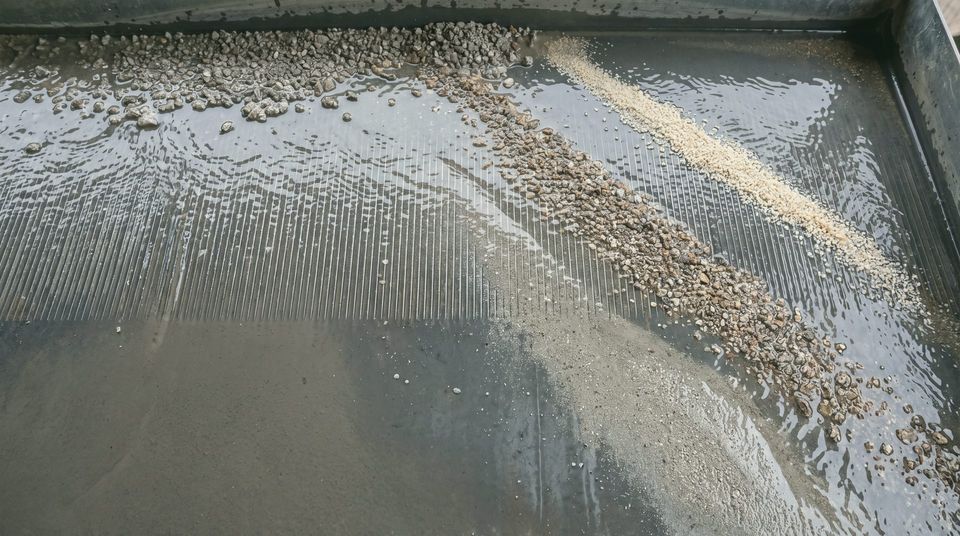
Scheelite concentrate in bands on a shaking table, from above.
Picture: Hercinia · 2880 px JPEG
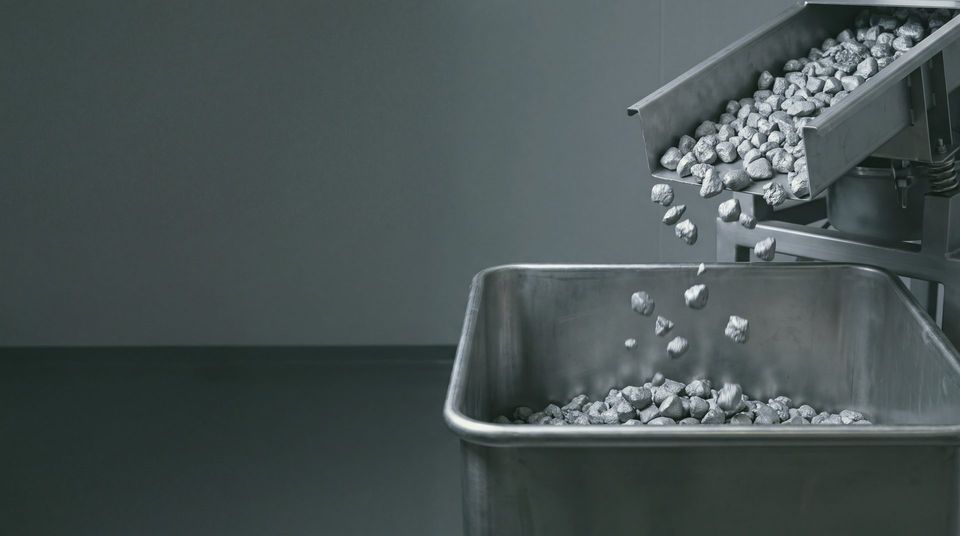
Lumps of titanium sponge falling from a feeder into a container.
Picture: Hercinia · 2880 px JPEG
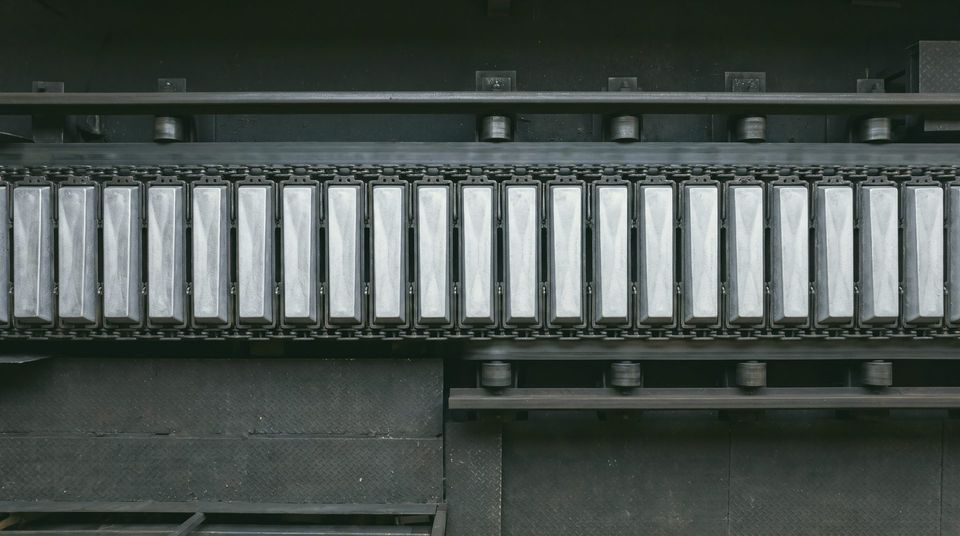
Magnesium ingots on a casting line, from above.
Picture: Hercinia · 2880 px JPEG
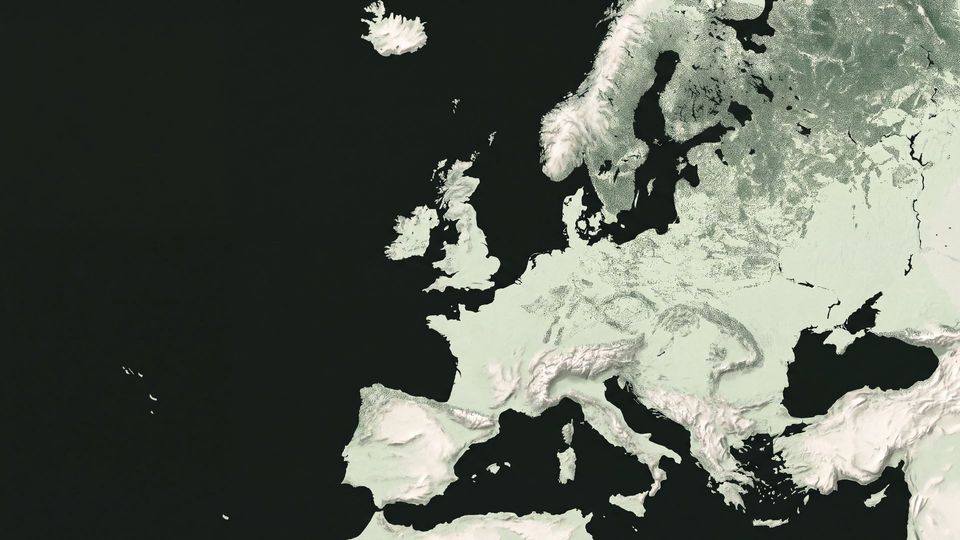
Europe as a painted relief map, mountains pale, the sea deep green.
Picture: Hercinia · 2880 px JPEG
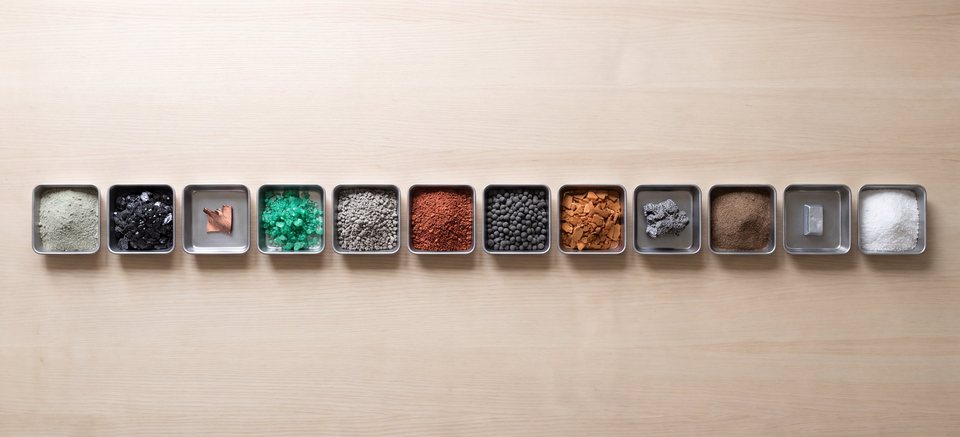
From above: twelve steel trays of raw materials in a row on a pale wooden table.
Picture: Hercinia · 2880 px JPEG
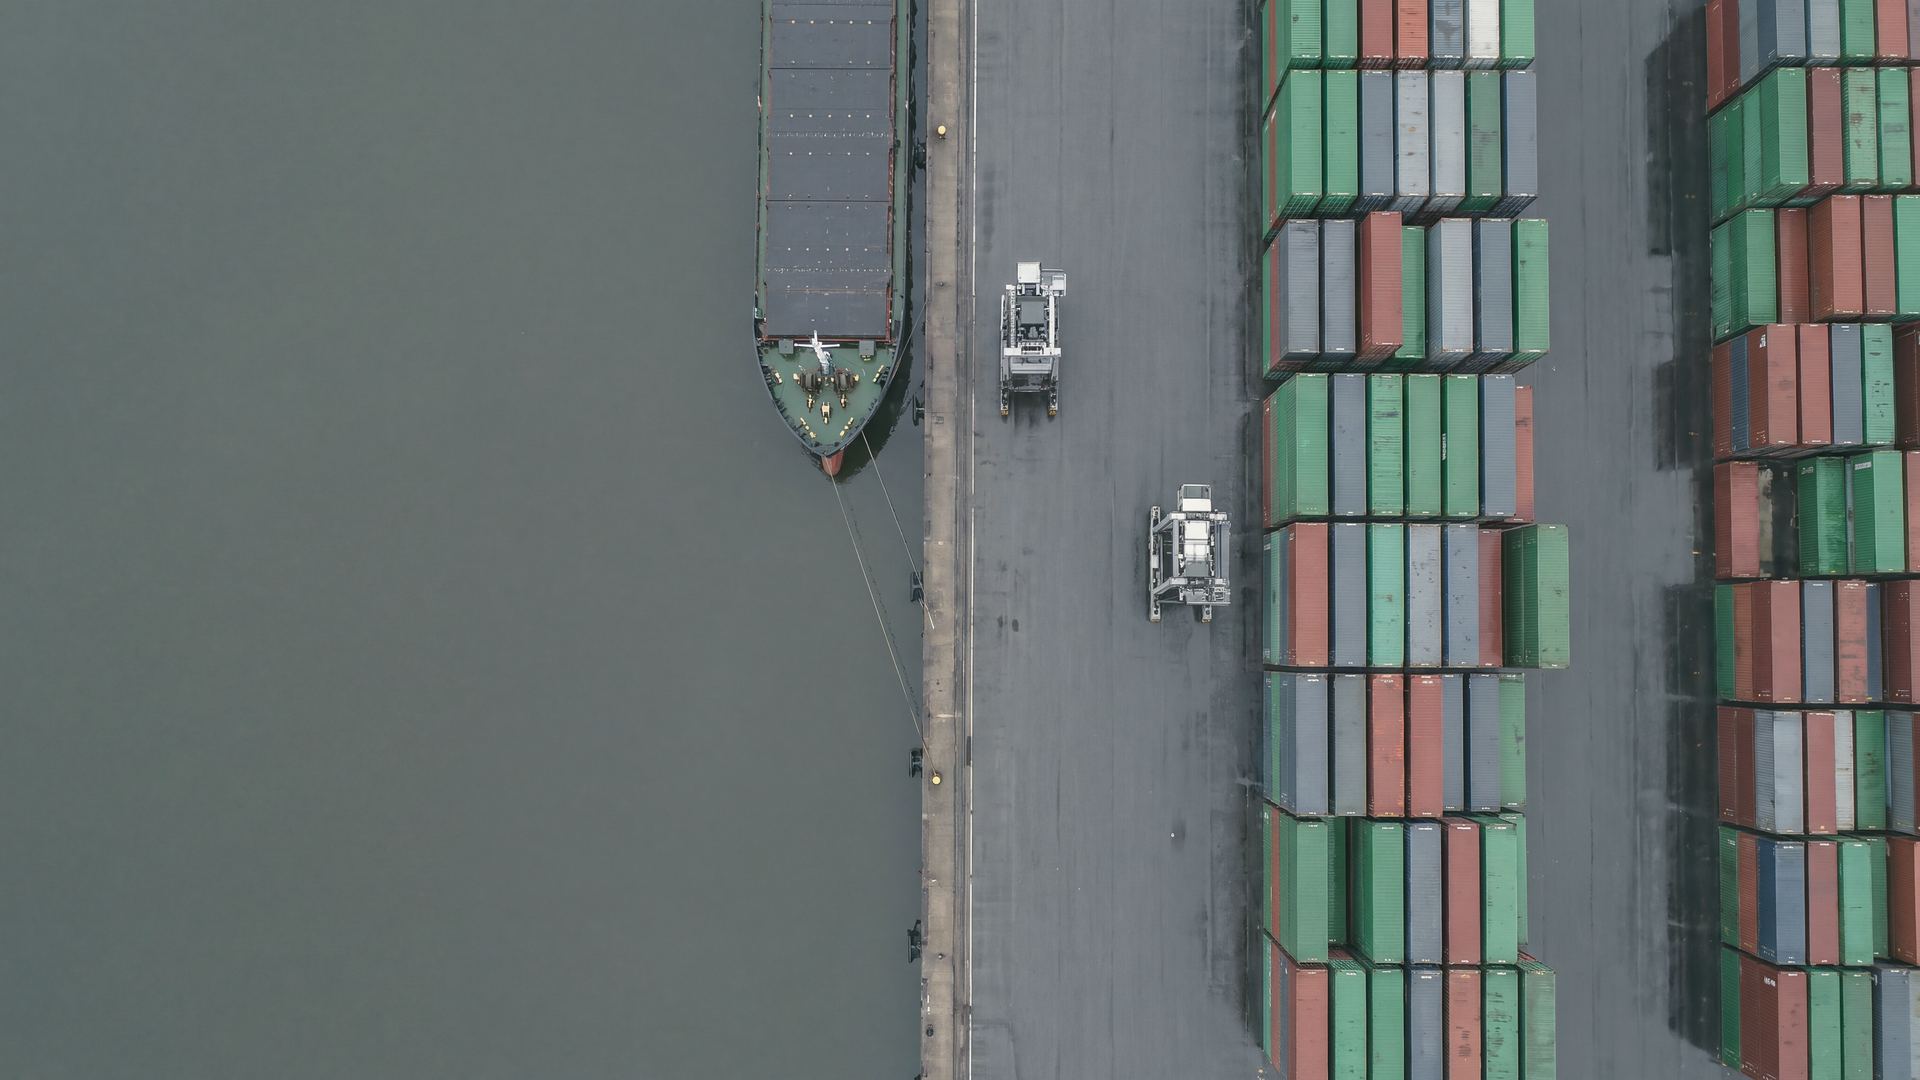
Unmarked containers and a cargo ship on a wet port quay in the rain, from above.
Picture: Hercinia · 2880 px JPEG
Data
The full workbook holds every table behind the Atlas, with a source for each row: materials, Europe’s own supply, deposits, Strategic Projects, products, disruptions, measures, partnerships, the import bill and public money. Every chart also has its own data button.
All files
Three files hold the whole press kit: every chart in PNG, SVG and PDF, light and dark; the infographics, key-figure cards and 35 material cards; the papers, fact sheet, posters, workbook and CSV files; and the pictures with captions. Each includes a README and the licence. Your browser builds the file when you click, which takes a few seconds.
Rights and credit
Hercinia’s charts, data and texts are licensed under CC BY 4.0. Use them in print, online and on air, change them to fit your page, and credit Hercinia.
Creative Commons Attribution 4.0 International (CC BY 4.0). You may copy, translate, adapt and publish, including commercially, with credit.
Licence textHercinia, Europe’s Critical Materials Atlas, CC BY 4.0. If you changed the item, say so.
Charts, infographics, key-figure and material cards, the map, data tables, the calculator, articles, papers and fact sheet, including Hercinia’s database rights in the compilation.
The figures come from the sources named on each item. They keep their own rights and do not endorse Hercinia. Charts using IEA material are works derived by Hercinia from IEA material, under CC BY 4.0; Hercinia alone is responsible for them, and they are not endorsed by the IEA. Eurostat is not responsible for this use of its data.
Generated illustrations made for Hercinia. They are not covered by the CC BY licence. Free for editorial use in reporting on critical raw materials or on Hercinia, with the credit “Picture: Hercinia”. Not for advertising, not to be altered to look like a real place or a Hercinia site, and not for training AI models.
The Hercinia name, logo and bird are trademarks and are not licensed. You may show the logo unchanged when reporting on Hercinia.
The SVG files use Noto Serif and Aspekta, both free under the SIL Open Font License. PNG and PDF files need no fonts.
Found a figure that needs correcting? Write to info@hercinia.eu.